57 lines
1.2 KiB
Markdown
57 lines
1.2 KiB
Markdown
|
|
---
|
||
|
|
title: gtop
|
||
|
|
private: false
|
||
|
|
date: '10:59 06-04-2018'
|
||
|
|
taxonomy:
|
||
|
|
category:
|
||
|
|
- blog
|
||
|
|
tag:
|
||
|
|
- tools
|
||
|
|
- monitoring
|
||
|
|
creator: erreur32
|
||
|
|
blog_url: /blog
|
||
|
|
show_sidebar: true
|
||
|
|
show_breadcrumbs: true
|
||
|
|
show_pagination: true
|
||
|
|
---
|
||
|
|
|
||
|
|

|
||
|
|
|
||
|
|
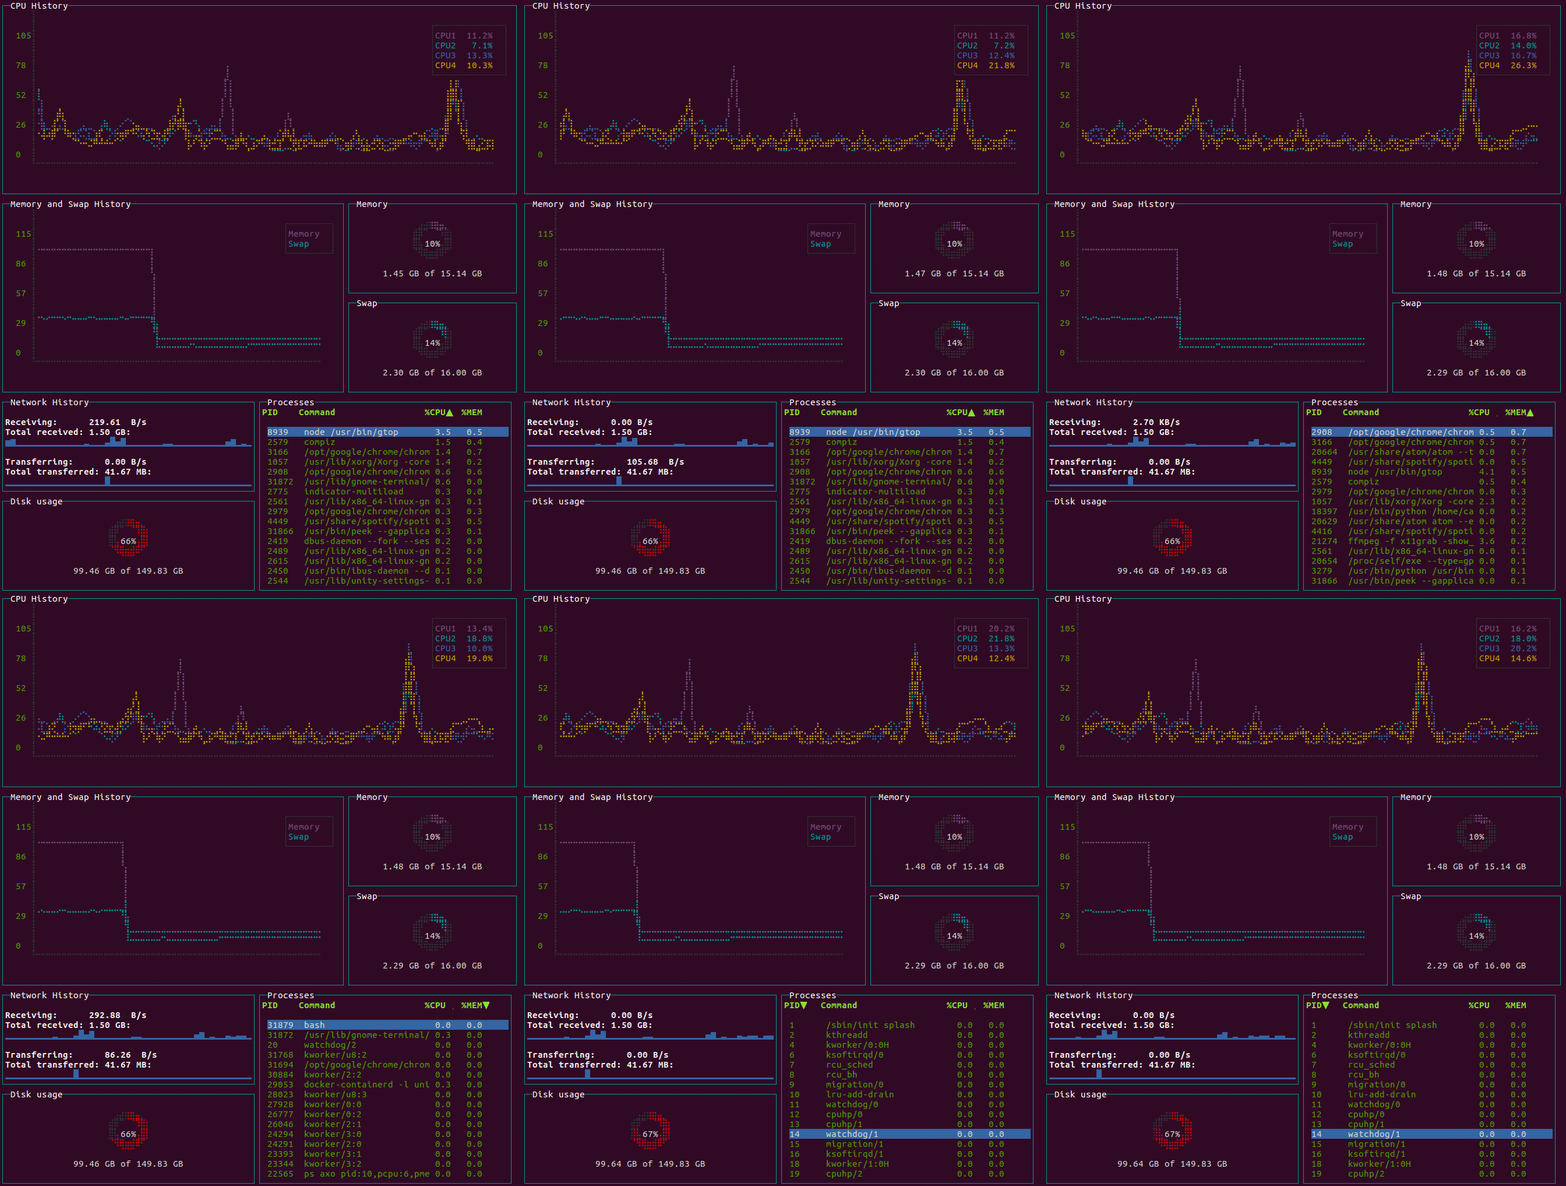
**GTOP** System monitoring dashboard for terminal.
|
||
|
|
|
||
|
|
[](https://npmjs.org/package/gtop)
|
||
|
|
[](https://npmjs.org/package/gtop)
|
||
|
|
[](https://build.snapcraft.io/user/aksakalli/gtop)
|
||
|
|
|
||
|
|
### Requirements
|
||
|
|
|
||
|
|
* Linux / OSX / Windows (partial support)
|
||
|
|
* Node.js >= v4
|
||
|
|
|
||
|
|
### Installation
|
||
|
|
|
||
|
|
```
|
||
|
|
$ npm install gtop -g
|
||
|
|
```
|
||
|
|
|
||
|
|
### Usage
|
||
|
|
|
||
|
|
You can sort the process table by pressing
|
||
|
|
|
||
|
|
* `p`: Process Id
|
||
|
|
* `c`: CPU usage
|
||
|
|
* `m`: Memory usage
|
||
|
|
|
||
|
|
### Troubleshooting
|
||
|
|
|
||
|
|
If you see question marks or other different characters, try to run it with these environment variables:
|
||
|
|
|
||
|
|
```
|
||
|
|
$ LANG=en_US.utf8 TERM=xterm-256color gtop
|
||
|
|
```
|
||
|
|
|
||
|
|
## License
|
||
|
|
|
||
|
|
Released under [the MIT license](LICENSE).
|
||
|
|
|
||
|
|
Link Project: [https://github.com/aksakalli/gtop/](https://github.com/aksakalli/gtop/)
|