|
|
||
|---|---|---|
| R | ||
| data | ||
| data-raw | ||
| dev | ||
| img | ||
| inst | ||
| man | ||
| tests | ||
| vignettes | ||
| .Rbuildignore | ||
| .gitignore | ||
| .travis.yml | ||
| DESCRIPTION | ||
| LICENSE | ||
| NAMESPACE | ||
| README.md | ||
README.md
apexcharter
Htmlwidget for apexcharts.js : A modern JavaScript charting library to build interactive charts and visualizations with simple API.


🚧 Under development !! API will change 🚧
⚠️ Use RStudio >= 1.2 to properly display charts
Note: Once again, development is heavily inspired by amazing highcharter.
Installation
You can install the development version from GitHub with:
# install.packages("devtools")
devtools::install_github("dreamRs/apexcharter")
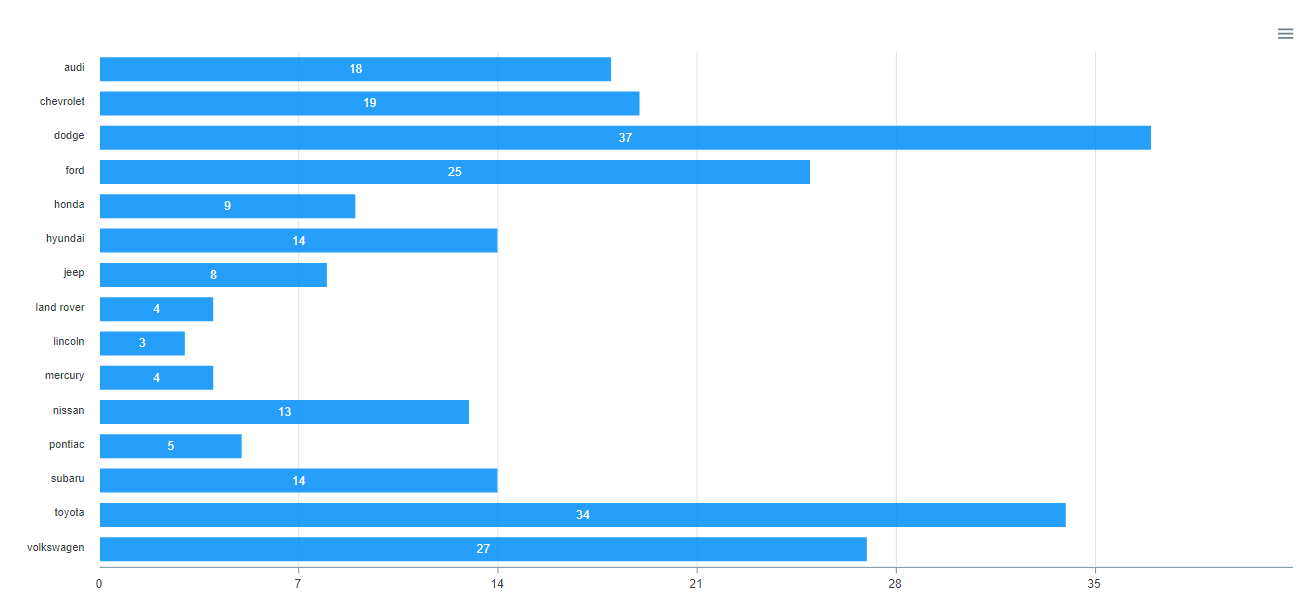
Quick Charts
Use apex function to quickly create visualizations :
library(apexcharter)

data("mpg", package = "ggplot2")
n_manufac <- dplyr::count(mpg, manufacturer)

apex(data = n_manufac, type = "bar", mapping = aes(x = manufacturer, y = n))
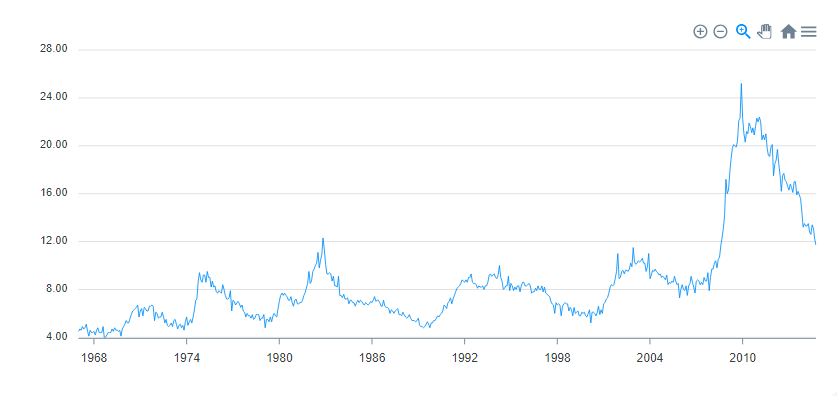
With datetime:
data("economics", package = "ggplot2")
apex(data = economics, type = "line", mapping = aes(x = date, y = uempmed)) %>%
  ax_stroke(width = 1)
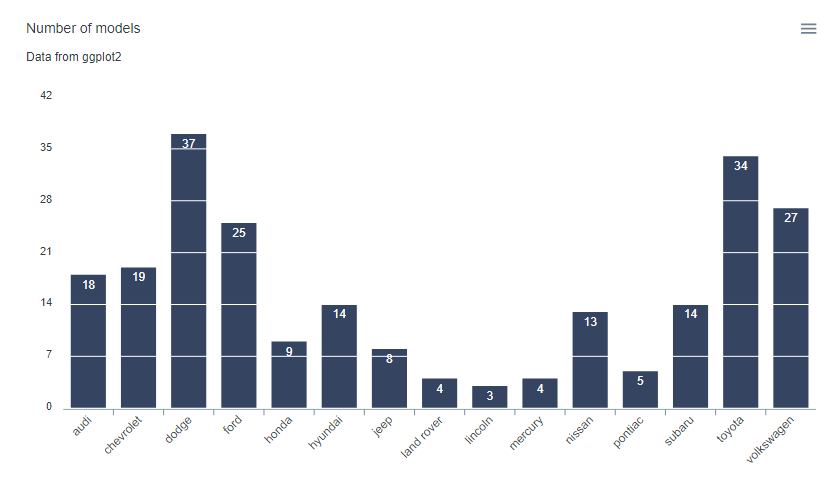
Full API
All methods from ApexCharts are available with function like ax_* compatible with pipe from magrittr :
library(apexcharter)
data(mpg, package = "ggplot2")
n_manufac <- dplyr::count(mpg, manufacturer)

apexchart() %>%
  ax_chart(type = "bar") %>%
  ax_plotOptions(bar = bar_opts(
    horizontal = FALSE,
    endingShape = "flat",
    columnWidth = "70%",
    dataLabels = list(
      position = "top"
    ))
  ) %>%
  ax_grid(
    show = TRUE,
    position = "front",
    borderColor = "#FFF"
  ) %>%
  ax_series(list(
    name = "Count",
    data = n_manufac$n
  )) %>%
  ax_colors("#112446") %>%
  ax_xaxis(categories = n_manufac$manufacturer) %>%
  ax_title(text = "Number of models") %>%
  ax_subtitle(text = "Data from ggplot2")
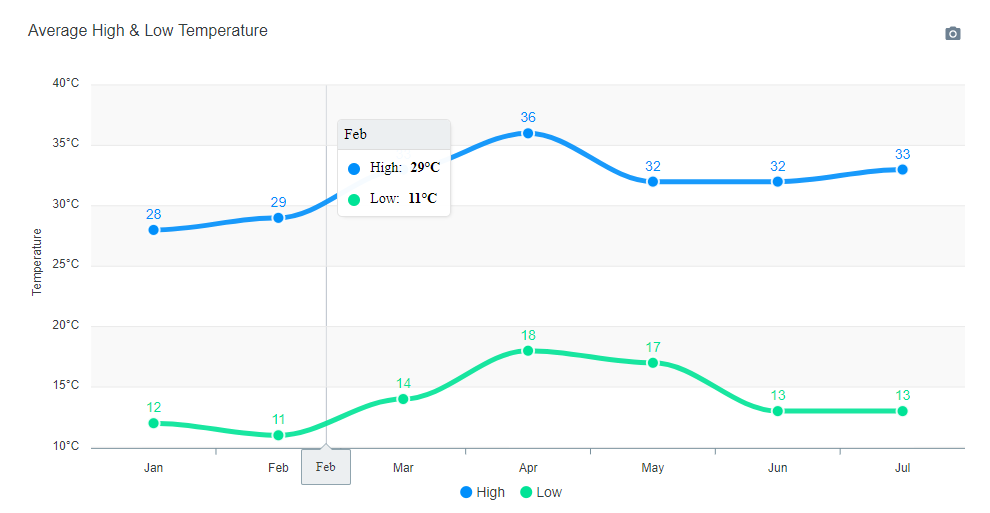
Raw API
Pass a list of parameters to the function:
apexchart(ax_opts = list(
  chart = list(
    type = "line"
  ),
  stroke = list(
    curve = "smooth"
  ),
  grid = list(
    borderColor = "#e7e7e7",
    row = list(
      colors = c("#f3f3f3", "transparent"),
      opacity = 0.5
    )
  ),
  dataLabels = list(
    enabled = TRUE
  ),
  markers = list(style = "inverted", size = 6),
  series = list(
    list(
      name = "High",
      data = c(28, 29, 33, 36, 32, 32, 33)
    ),
    list(
      name = "Low",
      data = c(12, 11, 14, 18, 17, 13, 13)
    )
  ),
  title = list(
    text = "Average High & Low Temperature",
    align = "left"
  ),
  xaxis = list(
    categories = month.abb[1:7]
  ),
  yaxis = list(
    title = list(text = "Temperature"),
    labels = list(
      formatter = htmlwidgets::JS("function(value) {return value + '°C';}")
    )
  )
))