|
|
||
|---|---|---|
| R | ||
| dev | ||
| img | ||
| inst/htmlwidgets | ||
| man | ||
| .Rbuildignore | ||
| .gitignore | ||
| DESCRIPTION | ||
| LICENSE | ||
| NAMESPACE | ||
| README.md | ||
README.md
apexcharter
Htmlwidget for apexcharts.js
🚧 ⚠️ Under development !! API will change (and this doesn't work properly in RStudio viewer for now) ⚠️ 🚧
Installation
You can install the development version from GitHub with:
# install.packages("devtools")
devtools::install_github("dreamRs/apexcharter")
Raw API
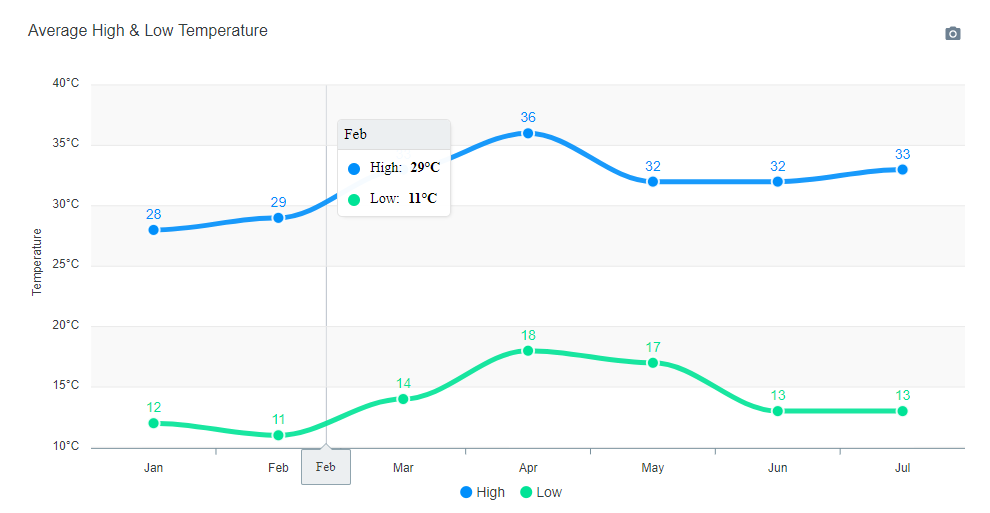
Only raw API available for now :
apexcharter(ax_opts = list(
  chart = list(
    type = "line"
  ),
  stroke = list(
    curve = "smooth"
  ),
  grid = list(
    borderColor = "#e7e7e7",
    row = list(
      colors = c("#f3f3f3", "transparent"),
      opacity = 0.5
    )
  ),
  dataLabels = list(
    enabled = TRUE
  ),
  markers = list(style = "inverted", size = 6),
  series = list(
    list(
      name = "High",
      data = c(28, 29, 33, 36, 32, 32, 33)
    ),
    list(
      name = "Low",
      data = c(12, 11, 14, 18, 17, 13, 13)
    )
  ),
  title = list(
    text = "Average High & Low Temperature",
    align = "left"
  ),
  xaxis = list(
    categories = month.abb[1:7]
  ),
  yaxis = list(
    title = list(text = "Temperature"),
    labels = list(
      formatter = htmlwidgets::JS("function(value) {return value + '°C';}")
    )
  )
))
