5.9 KiB
freebox-revolution-monitoring
Simple Freebox Revolution Monitoring with SexiGraf
Based/Inspired by https://github.com/tuxtof/freebox-monitoring
The newer freebox devices don't offer the hosted file with all the data information usually accessible (http://mafreebox.freebox.fr/pub/fbx_info.txt)
So this solution is leveraging the Freebox API but just focuses on the stats I'm interested in, if you want to extend the script check all the other things available here
Pre-requisites
This is what I used, you can of course adapt the collector script to talk to influxdb or whatever :-)
- SexiGraf or any Grafana/Graphite stack
- Telegraf
- Python with
json&requestslibraries installed - Physical Access to the Freebox Server device
Step 1: Register an app with the Freebox device
First thing to do is to register an app, to generate a specific App Token.
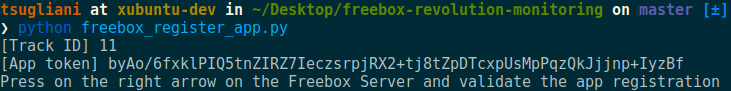
Use the freebox_register_app.py script.
PS: You can modify the app name/versions etc as shown below (Optional)
    app_info = {
        'app_id': 'fr.freebox.seximonitor',
        'app_name': 'SexiMonitor',
        'app_version': '0.4.2',
        'device_name': 'SexiServer'
    }
Once you execute this script, you will see something similar to this:
Head to your Freebox Derver device.
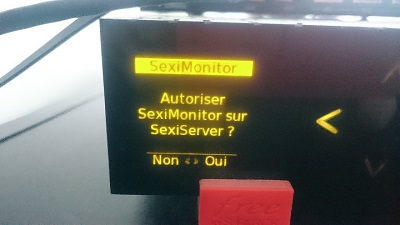
Press the > to authorize the app registration process.
Be sure to save the token somewhere safe, you will need it to authenticate against the freebox api afterwards :)
Step 2: Use the script to display freebox statistics information
Once you have your App Token, the process to authenticate happens in 2 steps:
- Fetch the current
challenge(basically a random generated string changing over time) - Compute a
session passwordwith thechallengeand yourApp Token
(This avoids sending the token over the network)
Edit the freebox_monitor.py script and set your App token/Track ID (line 73-74)
    freebox_app_token = "CHANGE_THIS"
    track_id = "CHANGE_THIS"
then execute it, to make sure it connects and display information
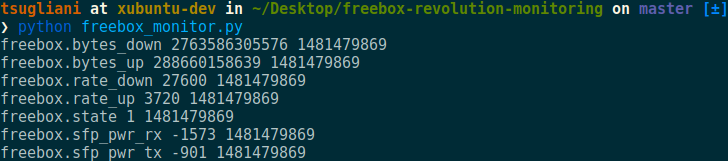
Step 3: Leverage telegraf to call the script and send it to Graphite
Install telegraf on the SexiGraf appliance.
wget https://dl.influxdata.com/telegraf/releases/telegraf_1.0.1_amd64.deb
dpkg -i telegraf_1.0.1_amd64.deb
Generate a config file for our plugins exec and graphite
telegraf --input-filter exec --output-filter graphite config > /etc/telegraf/telegraf.conf
You can then check & edit the configuration file to make it look as follows:
###############################################################################
#                            OUTPUT PLUGINS                                   #
###############################################################################

# Configuration for Graphite server to send metrics to
[[outputs.graphite]]
  ## TCP endpoint for your graphite instance.
  ## If multiple endpoints are configured, output will be load balanced.
  ## Only one of the endpoints will be written to with each iteration.
  servers = ["localhost:2003"]
  ## Prefix metrics name
  prefix = ""
  ## Graphite output template
  ## see https://github.com/influxdata/telegraf/blob/master/docs/DATA_FORMATS_OUTPUT.md
  template = "host.tags.measurement.field"
  ## timeout in seconds for the write connection to graphite
  timeout = 2

###############################################################################
#                            INPUT PLUGINS                                    #
###############################################################################

# Read metrics from one or more commands that can output to stdout
[[inputs.exec]]
  ## Commands array
  command = "/usr/local/freebox-revolution-monitoring/freebox_monitor.py"

  ## Timeout for each command to complete.
  timeout = "5s"

  ## Data format to consume.
  ## Each data format has it's own unique set of configuration options, read
  ## more about them here:
  ## https://github.com/influxdata/telegraf/blob/master/docs/DATA_FORMATS_INPUT.md
  data_format = "graphite"
Be sure to copy your modified freebox_monitor.py script to /usr/local/freebox-revolution-monitoring/
Relaunch telegraf and check the logs
root@sexigraf:~# tail -f /var/log/telegraf/telegraf.log
2016/12/11 18:26:30 Output [graphite] buffer fullness: 7 / 10000 metrics. Total gathered metrics: 675367. Total dropped metrics: 0.
2016/12/11 18:26:30 Output [graphite] wrote batch of 7 metrics in 165.892µs
2016/12/11 18:26:40 Output [graphite] buffer fullness: 7 / 10000 metrics. Total gathered metrics: 675374. Total dropped metrics: 0.
2016/12/11 18:26:40 Output [graphite] wrote batch of 7 metrics in 169.849µs
2016/12/11 18:26:50 Output [graphite] buffer fullness: 7 / 10000 metrics. Total gathered metrics: 675381. Total dropped metrics: 0.
2016/12/11 18:26:50 Output [graphite] wrote batch of 7 metrics in 183.453µs
2016/12/11 18:27:00 Output [graphite] buffer fullness: 7 / 10000 metrics. Total gathered metrics: 675388. Total dropped metrics: 0.
2016/12/11 18:27:00 Output [graphite] wrote batch of 7 metrics in 156.956µs
2016/12/11 18:27:10 Output [graphite] buffer fullness: 7 / 10000 metrics. Total gathered metrics: 675395. Total dropped metrics: 0.
2016/12/11 18:27:10 Output [graphite] wrote batch of 7 metrics in 170.216µs
2016/12/11 18:27:20 Output [graphite] buffer fullness: 7 / 10000 metrics. Total gathered metrics: 675402. Total dropped metrics: 0.
2016/12/11 18:27:20 Output [graphite] wrote batch of 7 metrics in 177.338µs
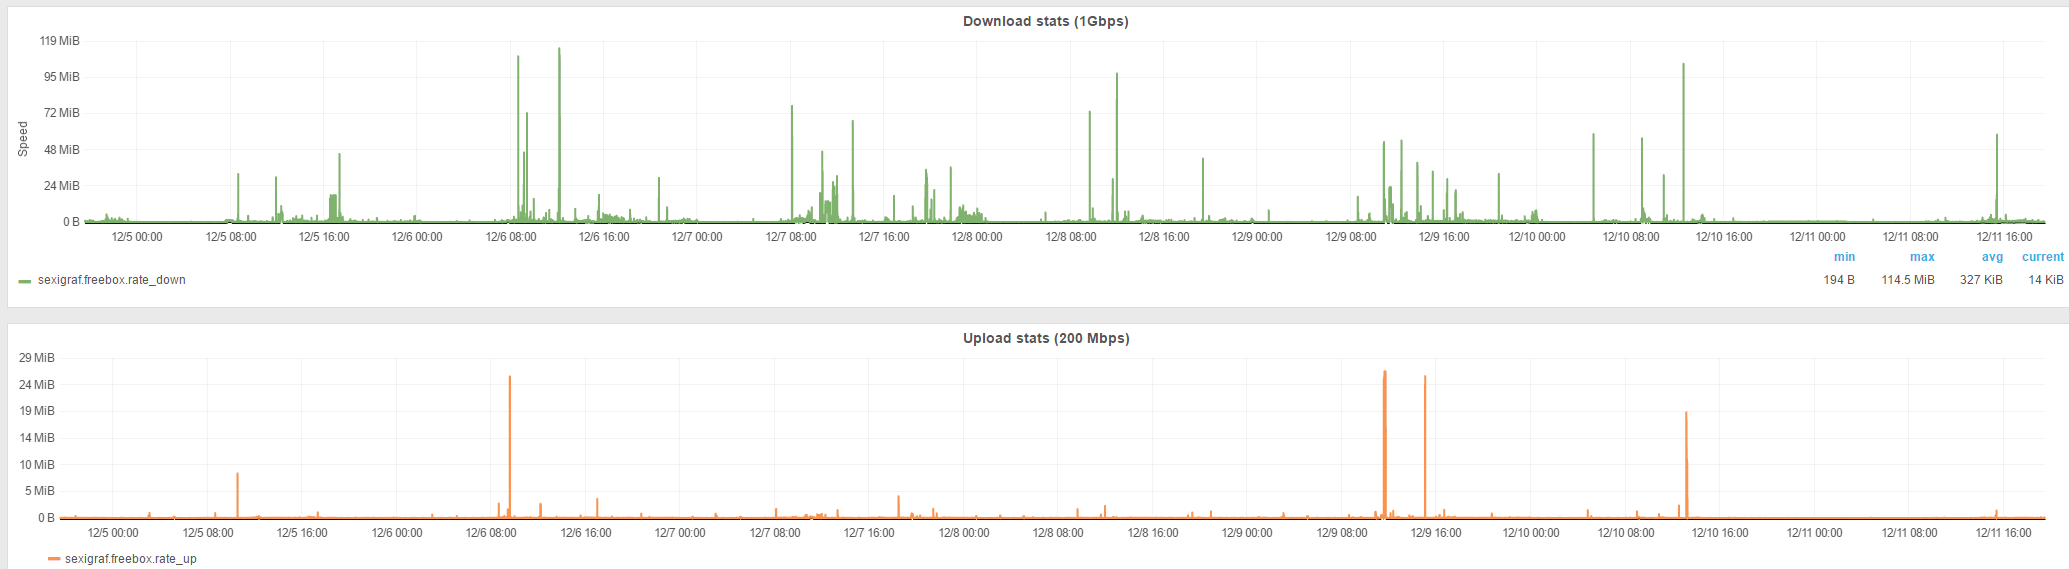
If the output is similar to this, you should be good to go and build your dashboards in SexiGraf. Here is a 2 day view of the download/upload stats.